October 20, 2026
Affiliate Scorecard: What to Measure Every Month
What an affiliate scorecard is
An affiliate scorecard is a single page, repeated every month for every partner, that shows how each source is performing against the same measures. It replaces the habit of looking at whichever number is loudest, usually volume or payout, with a steady routine that treats everyone alike.
The value is consistency. A partner who looks fine in one export can look quite different next to its own last six months, or next to a peer on the same offer. A scorecard makes those comparisons routine rather than something you do only when you are already worried.
It does not need to be elaborate. Ten or twelve measures in four groups, reviewed once a month, is enough for most programs.
Four groups of measures
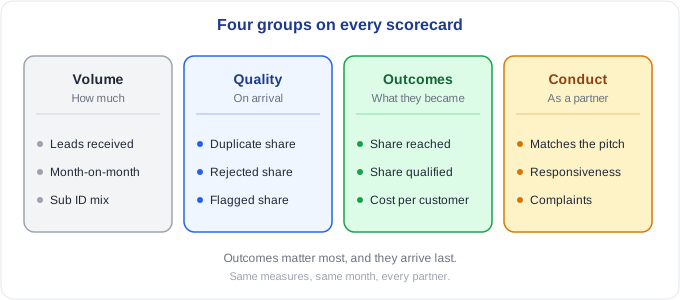
Volume. How much, and which way it is moving.
- Leads received this month.
- Change against the last few months.
- Mix of sub IDs or sources inside the partner's traffic.
Volume on its own says nothing about quality. Its main use is context: a source that doubles overnight deserves a question, and a source with a handful of leads cannot be judged at all.
Quality. What the leads look like when they arrive.
- Share of duplicates, including near-duplicates, as the email normalization guide explains.
- Share rejected, with reasons, as the lead scrubbing guide recommends.
- Share flagged by your checks for a closer look.
Outcomes. What the leads turned into. This is the group that matters most, and it takes the longest to be known.
- Share reached, meaning the person could be contacted.
- Share qualified.
- Customers and cost per customer.
Conduct. How the partner behaves as a partner.
- Whether the traffic matches what was described at the start.
- How quickly and clearly questions get answered.
- Any complaints from the people who filled in the form.
Conduct is the group most often left out of a scorecard, and it often explains the numbers in the others.
Rules for reading it fairly
A scorecard can mislead as easily as it can help. Four habits keep it honest.
Compare leads of the same age. Outcomes take days or weeks to appear, so this month's leads will always look weaker than last month's. Group leads by the week they arrived and compare like with like, as the conversion lag article explains.
Respect small samples. Ten leads can produce a rejection rate of zero or forty percent with no change in quality. Set a minimum number of leads below which the card says "too few to judge" instead of showing a rate.
Compare with peers and with the partner's own history. The right benchmark is another source on the same offer in the same weeks, and the partner's own previous months. A general rule of thumb from another program is a weak benchmark.
Show more than one measure at a time. A single odd number is often innocent. The affiliate fraud detection guide explains why several signals together are more convincing than one.
A fictional example
Here is what a month might look like for four invented sources.
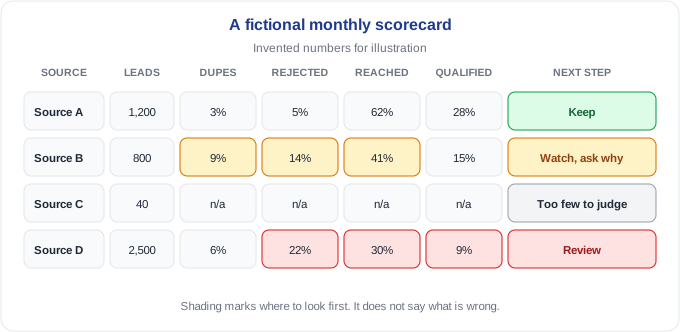
The first source is steady across the board. The second has more duplicates and rejections and fewer people reached, which is worth a conversation but not a conclusion. The third has too few leads to say anything. The fourth combines a high rejection share with poor reach and qualification, so a closer look makes sense.
None of this tells you what is wrong. It tells you where to spend your attention, which is the purpose of a scorecard.
Read the trend, not just the month
A single month is a snapshot. A run of months is a story.
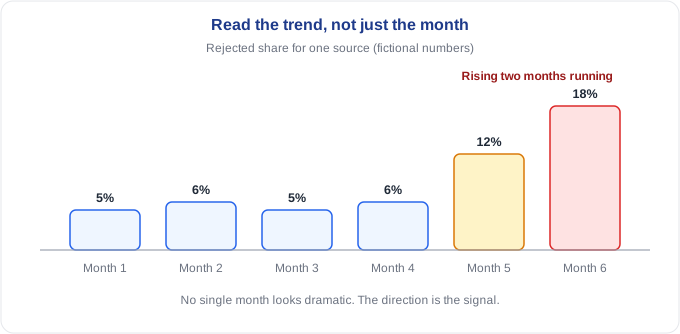
In the example above, the rejected share is steady for four months and then rises. No single month looks dramatic, but the direction is clear. Ask what changed: a new traffic source, a new landing page, a change in sub ID mix, or a different audience. Often the partner knows and simply has not mentioned it.
Trends also protect good partners. A single weak month followed by recovery is usually noise, and the scorecard makes that visible before anyone reacts.
Turning a scorecard into action
Treat each row as a prompt for a conversation, and keep the possible responses simple.
- Keep. Steady and healthy. Continue as is.
- Watch. Something moved. Ask what changed, and look again next month.
- Review. Several measures are off together. Sample the leads, and talk with the partner using the evidence.
- Too few to judge. Wait for more volume.
A flag means a source deserves a closer look, and the decision stays with you. Use the agreement as the basis for any action, and give a reason for each rejection. The agreement template guide has sample wording, and the payout reconciliation guide shows how to carry scorecard findings into the statement.
It also helps to share a version of the scorecard with the partner. Affiliates who can see the same numbers you see tend to fix problems faster, and the conversation starts from facts.
Where the data comes from
Most of the measures come from three places. Volume, duplicates and timing come from your lead export. Rejections come from your review notes. Reach, qualification and customers come from your sales or contact systems, which is why it is worth tagging every lead with its source and sub ID at the start. The checklist for spotting fake leads covers the checks that feed the quality group, and the guide to vetting affiliates explains what to record when a partner first joins.
A short checklist
- Use the same measures for every partner, every month.
- Group them: volume, quality, outcomes, conduct.
- Compare same-age leads, not this week with last month.
- Set a minimum sample before showing any rate.
- Benchmark against peers and the partner's own history.
- Read trends, not just snapshots.
- Respond in proportion: keep, watch, review or wait.
Filling in the quality group
The quality measures are the quickest to fill in, because they come straight from the export. If you would like to see them for your own leads, send us a recent lead export and we will run every lead through our checks and email you a report showing which ones look suspicious and why, at no cost. A flag means a lead deserves a closer look, and the decision stays with you.
Frequently asked questions
What is an affiliate scorecard? It is a recurring summary of the same measures for each affiliate, used to compare partners fairly and to spot changes early.
What should be on an affiliate scorecard? Volume, quality, outcomes and conduct. For example: leads and trend, duplicate and rejected share, share reached and qualified, and whether traffic matches what was described.
How often should I review it? Monthly suits most programs. High-volume programs may add a weekly check of the quality measures.
Why do new leads always look weaker? Because they have not had time to reach an outcome yet. Compare leads of the same age.
Should a bad scorecard lead to automatic removal? No. Treat it as a reason to look closer and talk to the partner, then act on your own evidence and your agreement.
A scorecard works because it makes you ask the same questions of every partner, every month.